Skip to content

Campaign Revenue Booster

The Smart Way to Campaign

Stop wasting budget on customers who would order anyway. Discover customers at risk of churn with predictive audience targeting, and drive tangible revenue growth from your discount campaigns with data-driven audience predictions and smarter budget allocation.

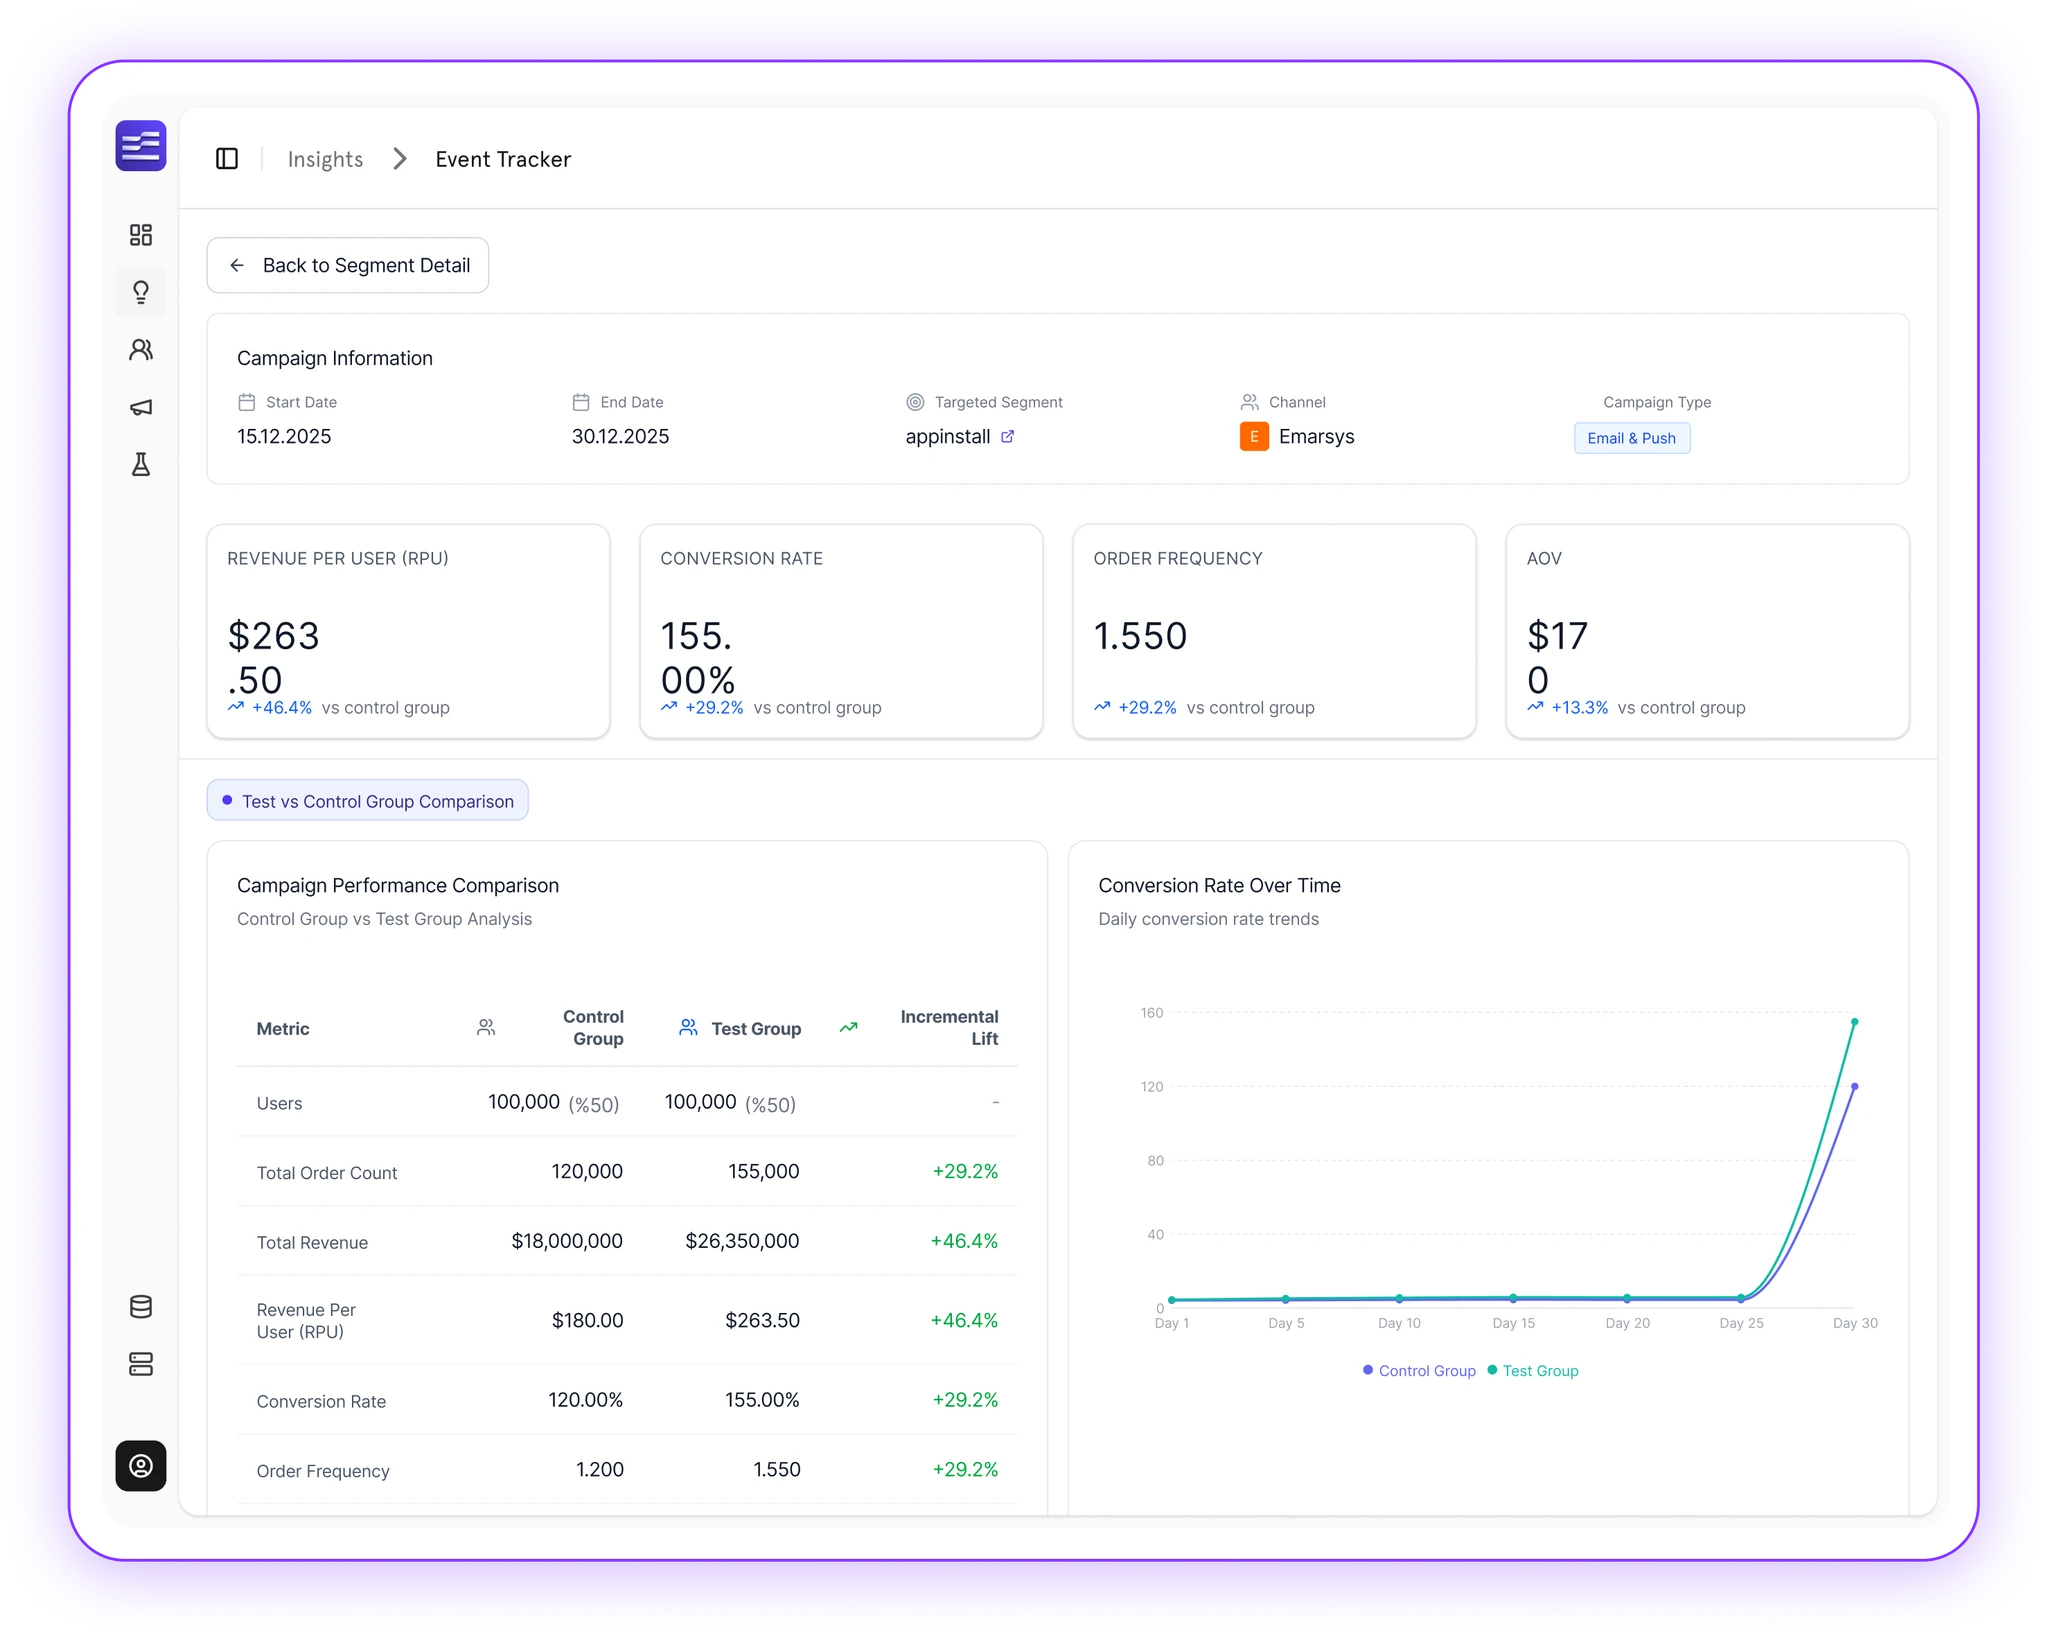
Campaign dashboard comparing test and control group revenue, conversion rate and order frequency

Traditional: Manual Segmentation

Your Campaign Audience: High Retention
Would order anyway; Churn Risk — Need incentive.
Campaign Budget
$10,000, spent on all manually segmented customers.
Wasted discounts on loyal customers.
Inefficient budget allocation.
Lower profit margins.
Total Revenue
$15,000

Smart Targeting: Predictive Segmentation

High Retention (No Campaign Needed)
Will order naturally.
Churn Risk (Targeted Campaign)
Receive incentive.
$8,500 spent ONLY on 3 churn-risk customers — saved $1,500.
No wasted budget on loyal customers.
Optimized budget allocation.
Higher profit margins.
The Result: More Revenue, Less Budget
Higher Revenue +20%, Less Campaign Spend -15%, Better ROI.
Total Revenue
$18,000

Increase Your Campaign Revenue by Up to 20%

Data-Driven Growth Platform.

Discover Customers at Risk of Churn with Predictive Audience Targeting.

Drive tangible revenue growth from your discount campaigns with data-driven audience predictions and smarter budget allocation.

Churn Reduction
-25%
Budget Optimization
+15%

Campaign Information

  • Start Date

    15.12.2025; End Date — 30.12.2025.

    Targeted Segment — appinstall; Channel — Emarsys; Campaign Type — Email & Push.

  • Revenue per User (RPU)

    $263.50 (+46.4% vs control group).

  • Conversion Rate

    155.00% (+29.2%).

  • Order Frequency

    1.550.

  • AOV

    $170 (+13.3%).

Campaign Performance Comparison

  • Test vs Control Group Comparison

    Control Group vs Test Group Analysis.

  • Users

    Control Group 100,000 vs Test Group 100,000.

  • Total Order Count

    Control Group 120,000 vs Test Group 155,000.

  • Revenue

    Control Group $18,000,000 vs Test Group $26,350,000.

  • Revenue Per User (RPU)

    Control Group $180.00 vs Test Group $263.50.

  • AOV

    Control Group $150.00 vs Test Group $170.00.

    • Conversion Rate Over Time — daily conversion rate trends trending up by 5.2% this month.
    • Showing total visitors for the last 6 months (20 November 2025 - 20 December 2025).

Start YourSUPER ANALYTICSJourney Now