Retention
Measure how many users come back after their first action — by day, week or month.
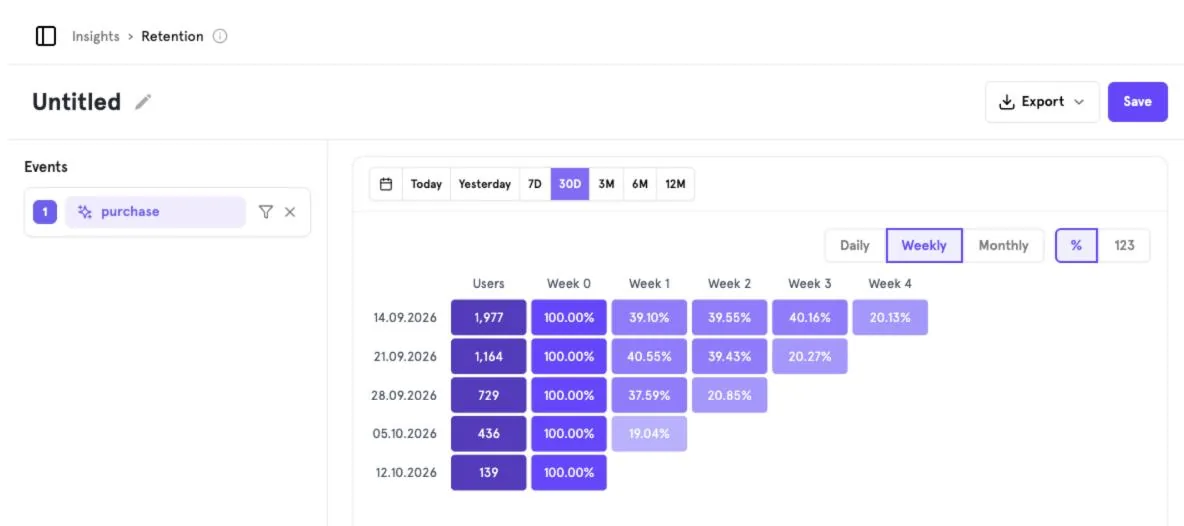
Read the cohort table#
- Each row is a cohort: users who performed the event in that period, with the cohort size in Users.
- Each column (Week 0, Week 1, …) shows the share of that cohort that came back.
- Darker cells mean higher retention.
Options#
- Daily Weekly Monthly — cohort granularity.
- % / 123 — show percentages or absolute user counts.
Was this page helpful?
Screenshots captured from the B2Metric E‑Commerce demo workspace, October 2026.