ROAS / ADS Optimization
See ad spend, traffic and revenue from every ad platform on one screen and spot which channels pay off.
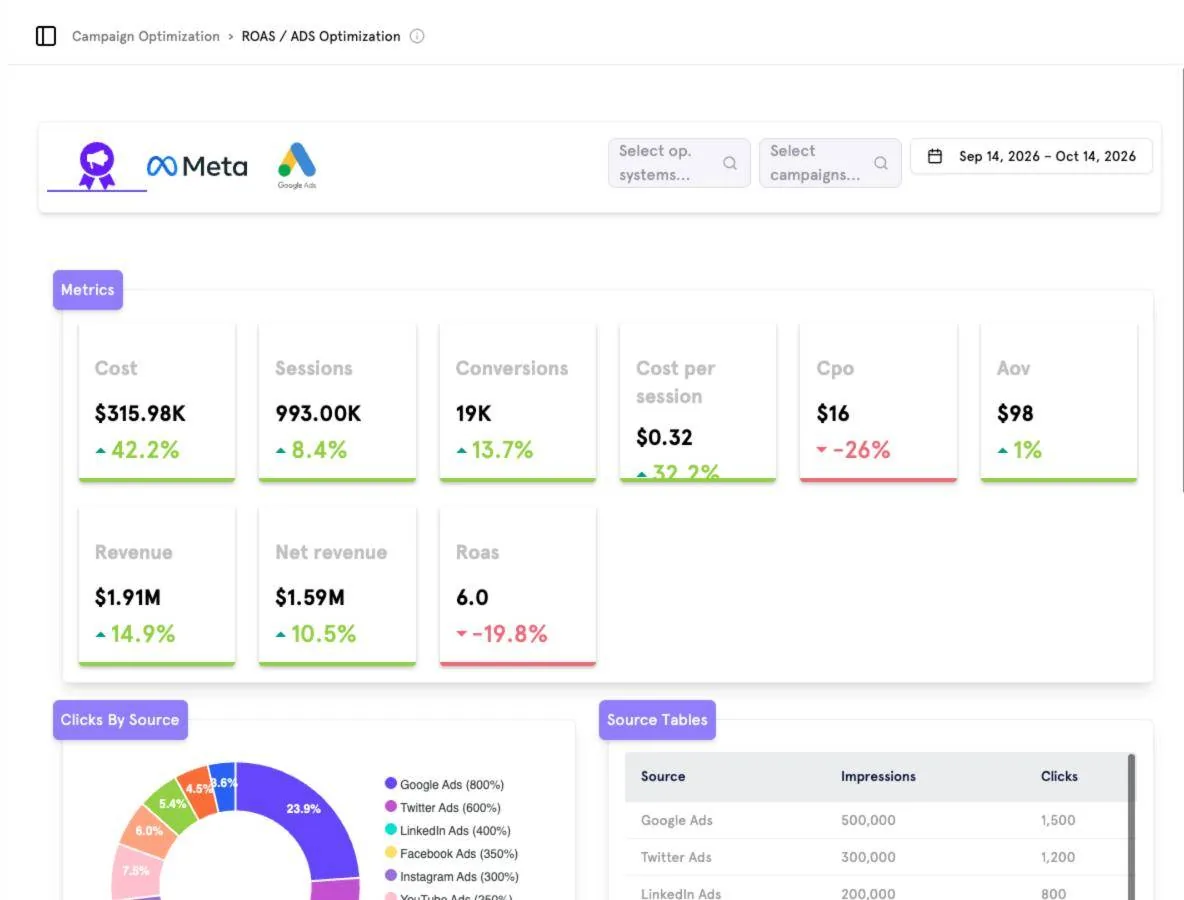
Filters#
Choose ad platforms (B2Metric, Meta, Google Ads), operating systems, campaigns and a date range at the top.
Metrics#
| Metric | Meaning |
|---|---|
| Cost | Total ad spend. |
| Sessions | Sessions attributed to ads. |
| Conversions | Conversions attributed to ads. |
| Cost per session | Cost ÷ sessions. |
| CPO | Cost per order. |
| AOV | Average order value. |
| Revenue / Net revenue | Gross and net revenue attributed to ads. |
| ROAS | Revenue ÷ cost. |
Each metric shows the change versus the previous period. Clicks by Source and Source Tables break performance down by ad source.
Was this page helpful?
Screenshots captured from the B2Metric E‑Commerce demo workspace, October 2026.